Header

Nifty Realty Index Is the Bull Run Losing Steam or Gearing Up for Another Rally - 28.03.2025

Nifty Realty Index Is the Bull Run Losing Steam or Gearing Up for Another Rally - 28.03.2025


Nifty Realty Index Is the Bull Run Losing Steam or Gearing Up for Another Rally - 28.03.2025

Nifty Realty Index Is the Bull Run Losing Steam or Gearing Up for Another Rally - 28.03.2025
K Karthik Raja (Market Educator & Technical Analyst)
MCA | MBA | M.Com | MSc Psychology | PGJMC | CST | MDAT | CFA Pursuant

Key Factors Affecting & Reasons:  
- The index has recently witnessed a correction after a strong uptrend.  
- Trading above key moving averages (50, 150, and 200), indicating long-term bullish sentiment.  
- Real estate demand, government policies, and interest rate movements are key drivers.  

Key Watch:  
- Support: 800 & 700 levels  
- Resistance: 900 & 1000 levels  
- Breakout above resistance could confirm renewed bullish momentum.  

Volume Analysis:  
- Volume has been moderate during the correction phase, indicating profit booking.  
- A surge in volume at support levels could confirm buying interest.  

Dow Theory Chart Analysis & Observations:  
- The index remains in a long-term uptrend.  
- A pullback to moving averages is considered healthy before another potential rally.  
- Higher highs and higher lows structure intact.  

Stocks to Watch:  
- DLF  
- Godrej Properties  
- Prestige Estates  
- Sobha Ltd  
- Oberoi Realty  

Market Insights:  
- Short-Term View: Possible consolidation before a breakout attempt.  
- Long-Term View: The realty sector remains fundamentally strong with rising demand and economic growth.

Disclaimer:  
This analysis is for informational purposes only and should not be considered financial advice. Please consult a professional before making investment decisions.

 Online Stock Market Traning :  Whatsapp  : 9841986753
One to One Share Market Training  :  Whatsapp  : 9841986753
RUPEEDESK SHARES
Rupeedesk Shares| Share Market Training | Intraday Training | Wealth creation

Stock Market Training for beginners,Technical Analysis on Equity,Commodity,Forex Market,Learn Indian Equity Share Market Share Market Trading Basics: Fundamentals Of Share Market Trading training, Stock Market Basics - Share Market Trading Basics,Share Market Trading Questions/Answers/Faq about Share Market derivatives,rupeedesk,learn and earn share Equity,Commodity and currency market traded in NSE,MCX,NCDEX And MCXSX- Rupeedesk.Contact: 9094047040/9841986753/ 044-24333577, www.rupeedesk.in) 

NIFTY Private Bank Index Analysis Key Insights & Market Outlook - 28.03.2025

NIFTY Private Bank Index Analysis Key Insights & Market Outlook  - 28.03.2025


NIFTY Private Bank Index Analysis Key Insights & Market Outlook  - 28.03.2025
NIFTY Private Bank Index Analysis Key Insights & Market Outlook  - 28.03.2025
NIFTY Private Bank Index Analysis Key Insights & Market Outlook  - 28.03.2025

NIFTY Private Bank Index Analysis Key Insights & Market Outlook  - 28.03.2025
K Karthik Raja (Market Educator & Technical Analyst)
MCA | MBA | M.Com | MSc Psychology | PGJMC | CST | MDAT | CFA Pursuant

Key Factors Affecting & Reasons:  
1. Moving Averages Support & Resistance:  
   - The index is trading above key moving averages (50, 150, 200, and 390).  
   - The 50-day MA (25073) is acting as immediate support.  
   - The 200-day MA (21822) and 390-day MA (18589) indicate strong long-term support.  

2. Momentum Indicators:  
   - RSI (57.76): Indicates neutral to slightly bullish momentum.  
   - ADX (17.41): Low ADX suggests weak trend strength.  
   - MACD: The MACD line is above the signal line, indicating bullish momentum.  
   - CCI (134.17): Suggests the index is in a strong upward move.  

3. Volume Analysis:  
   - The recent upmove is accompanied by moderate volume, suggesting a sustainable rally.  
   - A breakout above recent resistance with higher volume could confirm further upside.  

4. Dow Theory Chart Analysis & Observations:  
   - The index is in a long-term uptrend, consistently making higher highs and higher lows.  
   - The recent dip found support near the 50-day MA, confirming a bullish trend.  

Stocks to Watch:  
- Look for strong-performing private bank stocks that are outperforming the index.  
- Focus on banks with strong fundamentals and positive earnings trends.  

Market Insights:  
- Short-Term View: The index is in a consolidation phase; a breakout above recent highs could signal further bullishness.  
- Long-Term View: The overall trend remains bullish unless it breaks below key moving averages.

Disclaimer:  
This analysis is for informational purposes only and should not be considered financial advice. Please consult a professional before making investment decisions.

 Online Stock Market Traning :  Whatsapp  : 9841986753
One to One Share Market Training  :  Whatsapp  : 9841986753
RUPEEDESK SHARES
Rupeedesk Shares| Share Market Training | Intraday Training | Wealth creation

Stock Market Training for beginners,Technical Analysis on Equity,Commodity,Forex Market,Learn Indian Equity Share Market Share Market Trading Basics: Fundamentals Of Share Market Trading training, Stock Market Basics - Share Market Trading Basics,Share Market Trading Questions/Answers/Faq about Share Market derivatives,rupeedesk,learn and earn share Equity,Commodity and currency market traded in NSE,MCX,NCDEX And MCXSX- Rupeedesk.Contact: 9094047040/9841986753/ 044-24333577, www.rupeedesk.in) 

Nifty Metal Weekly Analysis Is the Rally Over or Just a Pause - 28.03.2025

Nifty Metal Weekly Analysis Is the Rally Over or Just a Pause - 28.03.2025


Nifty Metal Weekly Analysis Is the Rally Over or Just a Pause - 28.03.2025

Nifty Metal Weekly Analysis Is the Rally Over or Just a Pause - 28.03.2025
K Karthik Raja (Market Educator & Technical Analyst)
MCA | MBA | M.Com | MSc Psychology | PGJMC | CST | MDAT | CFA Pursuant

Key Factors Affecting & Reasons  
1. Global commodity prices – Rising or falling metal prices impact the index directly.  
2. China’s demand – As a major consumer of metals, any slowdown or stimulus from China affects the sector.  
3. Supply chain and inflation – Higher input costs and supply constraints can impact profitability.  
4. Technical pullback – The index is currently consolidating after a strong rally.  

Key Watch  
- Support levels: 9000 and 7360  
- Resistance levels: 9200 and 11000  
- Indicators to monitor: RSI at 53.11 (neutral zone), MACD showing bearish divergence, ADX at 21.17 (indicating a weak trend).  

Volume Analysis  
- High volume near support suggests buying interest.  
- Volume contraction near resistance may indicate hesitation or profit booking.  

Dow Theory Chart Analysis & Observations  
- Primary trend: Bullish long-term uptrend.  
- Secondary trend: Corrective pullback after a steep rise.  
- Key observations: Price is testing the 50-day moving average, which could act as strong support.  

Stocks to Watch  
- Tata Steel  
- JSW Steel  
- Hindalco Industries  
- Vedanta  
- Jindal Steel & Power  

Market Insights  

Short-Term View  
- The index may consolidate before making a decisive move.  
- Watch for a breakout above resistance or breakdown below support.  

Long-Term View  
- The metal sector remains strong with demand from infrastructure and manufacturing.  
- Global economic trends will play a crucial role in shaping future movements.

Disclaimer:  
This analysis is for informational purposes only and should not be considered financial advice. Please consult a professional before making investment decisions.

 Online Stock Market Traning :  Whatsapp  : 9841986753
One to One Share Market Training  :  Whatsapp  : 9841986753
RUPEEDESK SHARES
Rupeedesk Shares| Share Market Training | Intraday Training | Wealth creation

Stock Market Training for beginners,Technical Analysis on Equity,Commodity,Forex Market,Learn Indian Equity Share Market Share Market Trading Basics: Fundamentals Of Share Market Trading training, Stock Market Basics - Share Market Trading Basics,Share Market Trading Questions/Answers/Faq about Share Market derivatives,rupeedesk,learn and earn share Equity,Commodity and currency market traded in NSE,MCX,NCDEX And MCXSX- Rupeedesk.Contact: 9094047040/9841986753/ 044-24333577, www.rupeedesk.in) 

Nifty Pharma Weekly Analysis Key Trends & Stocks to Watch - 28.03.2025

Nifty Pharma Weekly Analysis Key Trends & Stocks to Watch - 28.03.2025


Nifty Pharma Weekly Analysis Key Trends & Stocks to Watch - 28.03.2025

Nifty Pharma Weekly Analysis Key Trends & Stocks to Watch - 28.03.2025
K Karthik Raja (Market Educator & Technical Analyst)
MCA | MBA | M.Com | MSc Psychology | PGJMC | CST | MDAT | CFA Pursuant

Key Factors Affecting & Reasons:  
1. Sector Performance – The Nifty Pharma index has seen a strong rally, supported by robust earnings and global demand for Indian pharmaceuticals.  
2. Technical Pullback – After a sharp uptrend, the index is currently experiencing a retracement near the 50-day moving average.  
3. Regulatory Developments – Any changes in US FDA approvals, government policies, or pricing controls can significantly impact stock movements.  
4. Global Economic Trends – With increasing healthcare spending worldwide, pharma stocks remain a long-term growth prospect.  

Key Watch:  
- Support Levels: 21,000 & 19,500  
- Resistance Levels: 22,500 & 25,000  
- Indicators to Monitor: RSI at 47.43 (neutral zone), MACD showing slight bearish divergence, ADX at 20.85 (indicating trend strength is weakening).  

Volume Analysis:  
- Increased trading volume suggests strong institutional participation.  
- Volume spikes near resistance indicate potential profit booking.  

Dow Theory Chart Analysis & Observations:  
- Primary Trend: Bullish with a long-term uptrend intact.  
- Secondary Trend: Pullback observed after a steep rally.  
- Support Confirmation: If price holds above 50-day MA, uptrend continuation is likely.  

Stocks to Watch:  
- Dr. Reddy’s Laboratories (DRREDDY)  
- Sun Pharma (SUNPHARMA)  
- Cipla (CIPLA)  
- Lupin (LUPIN)  
- Aurobindo Pharma (AUROPHARMA)  

Market Insights:  

Short-Term View:  
- Expect some consolidation or a minor correction before resuming the uptrend.  
- Watch for RSI levels to stabilize and MACD crossover for confirmation.  

Long-Term View:  
- The pharma sector remains a strong bet for long-term investors.  
- Fundamental growth, increasing R&D investments, and global expansion strategies are key positive factors.

Disclaimer:  
This analysis is for informational purposes only and should not be considered financial advice. Please consult a professional before making investment decisions.

 Online Stock Market Traning :  Whatsapp  : 9841986753
One to One Share Market Training  :  Whatsapp  : 9841986753
RUPEEDESK SHARES
Rupeedesk Shares| Share Market Training | Intraday Training | Wealth creation

Stock Market Training for beginners,Technical Analysis on Equity,Commodity,Forex Market,Learn Indian Equity Share Market Share Market Trading Basics: Fundamentals Of Share Market Trading training, Stock Market Basics - Share Market Trading Basics,Share Market Trading Questions/Answers/Faq about Share Market derivatives,rupeedesk,learn and earn share Equity,Commodity and currency market traded in NSE,MCX,NCDEX And MCXSX- Rupeedesk.Contact: 9094047040/9841986753/ 044-24333577, www.rupeedesk.in) 

Nifty FMCG Steady Growth or Signs of a Slowdown - 28.03.2025

Nifty FMCG Steady Growth or Signs of a Slowdown - 28.03.2025


Nifty FMCG Steady Growth or Signs of a Slowdown - 28.03.2025

Nifty FMCG Steady Growth or Signs of a Slowdown - 28.03.2025
K Karthik Raja (Market Educator & Technical Analyst)
MCA | MBA | M.Com | MSc Psychology | PGJMC | CST | MDAT | CFA Pursuant

The Nifty FMCG Index has been a strong performer, driven by consistent demand, pricing power, and defensive characteristics. However, recent corrections suggest a need to reassess its trajectory. Let's analyze the key factors influencing the FMCG sector and potential opportunities.  

Key factors affecting & reasons:  
* The index is experiencing a pullback after a prolonged uptrend, with key support levels being tested.  
* Inflationary pressures and raw material cost fluctuations impact margins.  
* Rural demand recovery remains a critical growth driver for the sector.  
* Strong brand loyalty and pricing power support revenue stability despite economic uncertainty.  
* Regulatory policies, taxation, and changing consumer preferences influence long-term trends.  

Key watch:  
* The 50-day moving average is acting as resistance; a breakout could indicate renewed momentum.  
* RSI at 42 suggests the index is near neutral territory after recent declines.  
* MACD remains in negative territory, signaling weak momentum, but a crossover could hint at recovery.  
* Key support near the 200-day moving average will be crucial in determining downside risks.  

Volume analysis:  
* Recent trading volumes indicate steady institutional interest, with some profit booking at higher levels.  
* Defensive nature of FMCG stocks attracts investors during uncertain market conditions.  
* A high-volume breakout above resistance could confirm renewed buying interest.  

Dow theory chart analysis & observations:  
* The index has followed a strong uptrend, making higher highs and higher lows.  
* The recent correction is bringing it closer to key support zones, testing the long-term moving averages.  
* Historical trends suggest that FMCG stocks remain resilient in volatile markets.  
* Failure to hold current levels could trigger further downside, while a breakout could signal continued strength.  

Stocks to watch:  
* Hindustan Unilever – Market leader with a strong portfolio and pricing power.  
* ITC – Diversified revenue streams with growth in FMCG and steady cigarette sales.  
* Dabur – Strong presence in ayurvedic and natural products, benefiting from changing consumer preferences.  
* Nestlé India – Defensive stock with strong brand loyalty and steady demand.  
* Britannia – Growth in bakery and dairy segments, benefiting from urban demand.  

Market insights: short-term and long-term view:  
* Short-term: Possible consolidation as the market digests recent corrections and inflation concerns.  
* Long-term: FMCG remains a stable and defensive sector, with consistent demand, brand loyalty, and steady earnings growth.  

Disclaimer:  
This analysis is for informational purposes only and should not be considered financial advice. Please consult a professional before making investment decisions.

 Online Stock Market Traning :  Whatsapp  : 9841986753
One to One Share Market Training  :  Whatsapp  : 9841986753
RUPEEDESK SHARES
Rupeedesk Shares| Share Market Training | Intraday Training | Wealth creation

Stock Market Training for beginners,Technical Analysis on Equity,Commodity,Forex Market,Learn Indian Equity Share Market Share Market Trading Basics: Fundamentals Of Share Market Trading training, Stock Market Basics - Share Market Trading Basics,Share Market Trading Questions/Answers/Faq about Share Market derivatives,rupeedesk,learn and earn share Equity,Commodity and currency market traded in NSE,MCX,NCDEX And MCXSX- Rupeedesk.Contact: 9094047040/9841986753/ 044-24333577, www.rupeedesk.in) 

NIFTY Media Index Breakdown Market Outlook - 28.03.2025

NIFTY Media Index Breakdown Market Outlook - 28.03.2025


NIFTY Media Index Breakdown Market Outlook - 28.03.2025

NIFTY Media Index Breakdown Market Outlook - 28.03.2025
K Karthik Raja (Market Educator & Technical Analyst)
MCA | MBA | M.Com | MSc Psychology | PGJMC | CST | MDAT | CFA Pursuant

Key Factors Affecting & Observations:  
1. Price Action & Trend:
   - The index is in a clear downtrend since its peak in 2021.  
   - Recent price action shows continued weakness, breaking below major moving averages.  

2. Moving Averages (MA): 
   - 50-day MA (1883.72), 150-day MA (1981.52), 200-day MA (2007.10), and 390-day MA (2090.72) are all above the current price (1475.25).  
   - This suggests a bearish trend with strong resistance at these levels.  

3. Volume Analysis: 
   - 313.804M volume indicates active trading, but no major spike suggesting accumulation.  

4. Indicators Breakdown: 
   - RSI (35.82):  
     - Close to oversold levels (below 30 indicates extreme weakness).  
     - Potential for a short-term bounce, but the overall trend remains weak.  
   - ADX (42.68):  
     - Indicates a strong trend (above 25), confirming the downtrend momentum.  
   - MACD (-16.68, -140.00, -123.32):  
     - Negative values confirm bearish momentum with no bullish crossover in sight.  
   - CCI (-72.74):  
     - Nearing oversold territory, but not yet signaling a reversal.  

Key Watch:  
1. Support Levels:  
   - 1400-1450 zone – If broken, further downside possible.  
2. Resistance Levels:  
   - 1500-1550: Short-term resistance.  
   - 2000: Strong long-term resistance (200-day MA).  
3. Dow Theory Observations:  
   - Lower highs and lower lows confirm a bear market structure.  

Stocks to Watch in Media Sector:  
- Look for strong relative performers in the sector.  
- Stocks with better fundamentals may hold support levels better than the index.  

Market Insights (Short-Term & Long-Term View):  
- Short-Term: Possible relief bounce due to oversold RSI, but trend remains bearish.  
- Long-Term: Needs a breakout above 2000 levels for a bullish reversal.  

Conclusion:  
- Bearish trend continues unless price breaks above key moving averages.  
- Short-term traders: Watch for bounce opportunities.  
- Long-term investors: Avoid until a reversal is confirmed.  

Disclaimer: This is for educational purposes only. Not financial advice. Do your own research before making any investment decisions.

 Online Stock Market Traning :  Whatsapp  : 9841986753
One to One Share Market Training  :  Whatsapp  : 9841986753
RUPEEDESK SHARES
Rupeedesk Shares| Share Market Training | Intraday Training | Wealth creation

Stock Market Training for beginners,Technical Analysis on Equity,Commodity,Forex Market,Learn Indian Equity Share Market Share Market Trading Basics: Fundamentals Of Share Market Trading training, Stock Market Basics - Share Market Trading Basics,Share Market Trading Questions/Answers/Faq about Share Market derivatives,rupeedesk,learn and earn share Equity,Commodity and currency market traded in NSE,MCX,NCDEX And MCXSX- Rupeedesk.Contact: 9094047040/9841986753/ 044-24333577, www.rupeedesk.in) 

Nifty Auto Index Is the Rally Over or Just a Pit Stop - 28.03.2025

Nifty Auto Index Is the Rally Over or Just a Pit Stop - 28.03.2025


Nifty Auto Index Is the Rally Over or Just a Pit Stop - 28.03.2025

Nifty Auto Index Is the Rally Over or Just a Pit Stop - 28.03.2025
K Karthik Raja (Market Educator & Technical Analyst)
MCA | MBA | M.Com | MSc Psychology | PGJMC | CST | MDAT | CFA Pursuant

The Nifty Auto Index has witnessed strong growth in recent years, driven by increased consumer demand, EV adoption, and improving economic conditions. However, recent corrections have raised concerns about short-term volatility. Let’s analyze the key factors, technical outlook, and potential stock opportunities.  

Key factors affecting & reasons:  
- The index is undergoing a pullback after a significant rally, with support near the 50-day moving average.  
- Growth in the EV sector and government incentives for auto manufacturing continue to provide a strong long-term outlook.  
- Rising interest rates and inflation could impact auto loan affordability, influencing demand.  
- Global supply chain disruptions and semiconductor shortages may create short-term pressure on production.  

Key watch:  
- The 50-day moving average is acting as resistance; a breakout above it could indicate renewed bullish momentum.  
- RSI is near 42, suggesting that the index is approaching neutral territory after recent corrections.  
- MACD remains negative, indicating weak momentum, but a crossover could signal a potential recovery.  
- Key support near the 200-day moving average will be crucial in determining further downside risks.  

Volume analysis:  
- Volume levels indicate steady participation, with spikes on key reversal days.  
- Institutional buying is visible on dips, suggesting long-term confidence in the sector.  
- A high-volume breakout above resistance could confirm the continuation of the uptrend.  

Dow theory chart analysis & observations:  
- The index has followed a long-term uptrend with higher highs and higher lows.  
- A recent correction has brought the index closer to key support zones.  
- The 150-day and 200-day moving averages have historically acted as strong support levels.  
- A failure to hold current levels could lead to further downside, while a breakout above recent resistance could attract fresh buying interest.  

Stocks to watch:  
- Maruti Suzuki – Market leader with strong sales momentum and expanding EV portfolio.  
- Tata Motors – Leading EV growth story, benefitting from domestic and global demand.  
- Mahindra & Mahindra – Strong SUV and EV sales driving revenue growth.  
- Bajaj Auto & Hero MotoCorp – Two-wheeler demand recovery post-pandemic could support upside.  
- Eicher Motors – Premium motorcycle segment showing steady growth.  

Market insights: short-term and long-term view:  
- Short-term: Possible consolidation or minor correction before a fresh uptrend, depending on key support levels.  
- Long-term: The auto sector remains a structural growth story, driven by EV adoption, technological advancements, and increasing demand for premium vehicles.  

Disclaimer:  
This analysis is for informational purposes only and should not be considered financial advice. Please consult with a professional before making investment decisions.

 Online Stock Market Traning :  Whatsapp  : 9841986753
One to One Share Market Training  :  Whatsapp  : 9841986753
RUPEEDESK SHARES
Rupeedesk Shares| Share Market Training | Intraday Training | Wealth creation

Stock Market Training for beginners,Technical Analysis on Equity,Commodity,Forex Market,Learn Indian Equity Share Market Share Market Trading Basics: Fundamentals Of Share Market Trading training, Stock Market Basics - Share Market Trading Basics,Share Market Trading Questions/Answers/Faq about Share Market derivatives,rupeedesk,learn and earn share Equity,Commodity and currency market traded in NSE,MCX,NCDEX And MCXSX- Rupeedesk.Contact: 9094047040/9841986753/ 044-24333577, www.rupeedesk.in) 

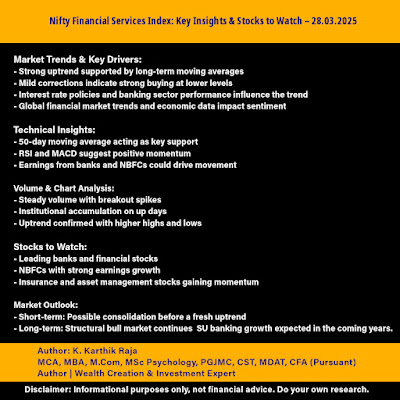
Nifty Financial Services Index Key Insights & Stocks to Watch – 28.03.2025

Nifty Financial Services Index Key Insights & Stocks to Watch – 28.03.2025


Nifty Financial Services Index Key Insights & Stocks to Watch – 28.03.2025

Nifty Financial Services Index Key Insights & Stocks to Watch – 28.03.2025
K Karthik Raja (Market Educator & Technical Analyst)
MCA | MBA | M.Com | MSc Psychology | PGJMC | CST | MDAT | CFA Pursuant

Key Factors Affecting & Reasons:  
- The index has been in a strong uptrend, supported by long-term moving averages.  
- Recent corrections have been mild, indicating strong buying interest at lower levels.  
- Interest rate policies and banking sector performance are influencing the overall trend.  
- Global financial market trends and economic data releases continue to impact sentiment.  

Key Watch:  
- The 50-day moving average (MA) is acting as immediate support.  
- Momentum indicators like RSI and MACD suggest a positive bias, but some consolidation may occur.  
- Any significant change in banking and NBFC earnings could drive price movement.  

Volume Analysis:  
- Volume has been steady, with occasional spikes during breakout attempts.  
- Higher volumes on up days indicate institutional accumulation.  
- A breakout with strong volume could confirm further upside.  

Dow Theory Chart Analysis & Observations:  
- The index follows higher highs and higher lows, confirming an uptrend.  
- Key resistance levels from previous highs need to be watched for potential reversals.  
- A sustained close above recent highs can trigger fresh buying interest.  

Stocks to Watch:  
- Leading banking and financial stocks are contributing to index movements.  
- NBFCs showing strong earnings growth could outperform.  
- Insurance and asset management stocks may gain momentum with market expansion.  

Market Insights: Short-Term and Long-Term View:  
- Short-term: Potential consolidation before a fresh uptrend if key supports hold.  
- Long-term: The index remains in a structural bull market, driven by financial sector growth and economic expansion.  

Disclaimer:  
This analysis is for informational purposes only and should not be considered financial advice. Please consult with a professional before making any investment decisions.

 Online Stock Market Traning :  Whatsapp  : 9841986753
One to One Share Market Training  :  Whatsapp  : 9841986753
RUPEEDESK SHARES
Rupeedesk Shares| Share Market Training | Intraday Training | Wealth creation

Stock Market Training for beginners,Technical Analysis on Equity,Commodity,Forex Market,Learn Indian Equity Share Market Share Market Trading Basics: Fundamentals Of Share Market Trading training, Stock Market Basics - Share Market Trading Basics,Share Market Trading Questions/Answers/Faq about Share Market derivatives,rupeedesk,learn and earn share Equity,Commodity and currency market traded in NSE,MCX,NCDEX And MCXSX- Rupeedesk.Contact: 9094047040/9841986753/ 044-24333577, www.rupeedesk.in) 

Nifty IT Index Key Insights & Stocks to Watch – 28.03.2025

Nifty IT Index Key Insights & Stocks to Watch – 28.03.2025


Nifty IT Index Key Insights & Stocks to Watch – 28.03.2025

Nifty IT Index Key Insights & Stocks to Watch – 28.03.2025
K Karthik Raja (Market Educator & Technical Analyst)
MCA | MBA | M.Com | MSc Psychology | PGJMC | CST | MDAT | CFA Pursuant

The Nifty IT Index has been a strong performer in recent years, reflecting the growth of India’s technology sector. However, recent corrections have raised questions about its short-term and long-term trajectory. Let’s analyze the key factors, technical outlook, and potential stock opportunities.  

Key Factors Affecting & Reasons  
- The index remains in a long-term uptrend, supported by key moving averages (50, 150, and 200-day MA).  
- Recent corrections suggest profit booking, but strong demand is visible near key support levels.  
- Global IT spending, U.S. Fed interest rate decisions, and earnings growth of major IT firms are crucial drivers.  
- Rupee movement against the dollar also plays a role in determining IT sector profitability.  

Key Watch  
- The 50-day moving average is a key resistance level; a breakout above it could signal renewed strength.  
- RSI is currently around 36, indicating the index is nearing oversold levels, which might trigger a short-term rebound.  
- MACD is in the negative territory, suggesting weak momentum in the short term.  
- A decisive close above recent highs will confirm the continuation of the uptrend.  

Volume Analysis  
- Trading volume has remained steady, with occasional spikes during major price movements.  
- Higher volume on down days suggests institutional profit booking.  
- A breakout with strong volume will be a key confirmation for further upside movement.  

Dow Theory Chart Analysis & Observations  
- The index has been making higher highs and higher lows, confirming a long-term uptrend.  
- The 200-day moving average has acted as strong support historically.  
- If the index fails to hold the 150-day MA, a deeper correction may occur.  

Stocks to Watch  
- TCS and Infosys – Key players in the IT index, closely tracking global tech trends.  
- HCL Tech and Wipro – Mid-tier IT companies showing strong order book growth.  
- LTIMindtree and Coforge – Strong earnings momentum could lead to outperformance.  
- Tech Mahindra – Potential recovery play based on telecom and AI-related demand.  

Market Insights: Short-Term and Long-Term View  
- Short-term: The index may witness consolidation before resuming an uptrend. If support levels hold, a potential bounce-back is expected.  
- Long-term: Structural growth in India’s IT sector, increased digital transformation, and AI-led innovations support a bullish outlook.  

Disclaimer  
This analysis is for informational purposes only and should not be considered financial advice. Please consult with a professional before making investment decisions.
 Online Stock Market Traning :  Whatsapp  : 9841986753
One to One Share Market Training  :  Whatsapp  : 9841986753
RUPEEDESK SHARES
Rupeedesk Shares| Share Market Training | Intraday Training | Wealth creation

Stock Market Training for beginners,Technical Analysis on Equity,Commodity,Forex Market,Learn Indian Equity Share Market Share Market Trading Basics: Fundamentals Of Share Market Trading training, Stock Market Basics - Share Market Trading Basics,Share Market Trading Questions/Answers/Faq about Share Market derivatives,rupeedesk,learn and earn share Equity,Commodity and currency market traded in NSE,MCX,NCDEX And MCXSX- Rupeedesk.Contact: 9094047040/9841986753/ 044-24333577, www.rupeedesk.in) 

Is This the Best Time to Buy or Sell AUDUSD Find Out Now!

Is This the Best Time to Buy or Sell AUDUSD Find Out Now!


Is This the Best Time to Buy or Sell AUDUSD Find Out Now!

Is This the Best Time to Buy or Sell AUDUSD Find Out Now!
K Karthik Raja (Market Educator & Technical Analyst)
MCA | MBA | M.Com | MSc Psychology | PGJMC | CST | MDAT | CFA Pursuant

Chart Pattern  
- The price is consolidating near the 0.63 level, suggesting indecision.  
- Moving averages are converging, indicating a potential breakout soon.  
- The pair has been trading in a range-bound structure with multiple rejections around 0.6310 and support at 0.6280.  

Dow Theory  
- Primary trend: Bearish, as seen from the overall downtrend since early February.  
- Secondary trend: Sideways, with price attempting to hold support near 0.63.  
- Minor trend: Short-term pullbacks, showing buying interest at lower levels.  

Upcoming Events to Watch  
- US economic data (NFP, CPI, Fed decisions) – affects USD strength.  
- Australian economic reports (employment data, RBA statements) – impacts AUD movement.  
- Global risk sentiment – as a commodity currency, AUD reacts to stock market trends & China’s economic outlook.  

Volume Analysis  
- Volume is relatively low, indicating a lack of strong buying or selling pressure.  
- A spike in volume could confirm the direction of the next move.  

Final Takeaway  
- AUD/USD is at a key decision level around 0.63.  
- A break above 0.6315 could trigger bullish momentum.  
- A drop below 0.6280 would confirm further downside.  

Breakout Strategy (Bullish)  
- Entry: Above 0.6315 | Stoploss: Below 0.6290 (recent support).  
- Target 1: 0.6350 | Target 2: 0.6380.

Breakdown Strategy (Bearish)  
- Entry: Below 0.6280 (break of support) | Stoploss: Above 0.6305.
- Target 1: 0.6250 | Target 2: 0.6225.

Disclaimer  
This analysis is for educational and informational purposes only. It does not constitute financial advice. Always consult a professional before making investment decisions.

 Online Stock Market Traning :  Whatsapp  : 9841986753
One to One Share Market Training  :  Whatsapp  : 9841986753
RUPEEDESK SHARES
Rupeedesk Shares| Share Market Training | Intraday Training | Wealth creation

Stock Market Training for beginners,Technical Analysis on Equity,Commodity,Forex Market,Learn Indian Equity Share Market Share Market Trading Basics: Fundamentals Of Share Market Trading training, Stock Market Basics - Share Market Trading Basics,Share Market Trading Questions/Answers/Faq about Share Market derivatives,rupeedesk,learn and earn share Equity,Commodity and currency market traded in NSE,MCX,NCDEX And MCXSX- Rupeedesk.Contact: 9094047040/9841986753/ 044-24333577, www.rupeedesk.in)